12월, 2017의 게시물 표시

Why Maryland’s Blue Crab Industry Might Be in Trouble - Eater

Why Maryland’s Blue Crab Industry Might Be in Trouble - Eater

The 30 Mile Zone That Explains Why Hollywood Exists

이미지

How smart is today's artificial intelligence?

이미지

How Machines Learn

이미지

Goodwill Norwalk Store-The Spirit of Giving

이미지

Goodwill Norwalk Store-The Spirit of Giving

이미지

The Map of Mathematics

이미지

Better prediction intervals for time series forecasts

구글 검색 키워드 https://www.google.com/webhp?sourceid=chrome-instant&ion=1&espv=2&ie=UTF-8#q=time%20range%20prediction Accuracy of Weather Forecasts in Time http://www.timeanddate.com/weather/forecast-accuracy-time.html Better prediction intervals for time series forecasts http://www.r-bloggers.com/better-prediction-intervals-for-time-series-forecasts/ http://repository.upenn.edu/cgi/viewcontent.cgi?article=1005&context=marketing_papers

knowledge acquisition

knowledge acquisition 한글 http://www.aistudy.co.kr/expert/knowledge_acquisition.htm 위키 https://en.wikipedia.org/wiki/Knowledge_acquisition Knowledge-based systems https://en.wikipedia.org/wiki/Knowledge-based_systems IF-THEN rules. [1] The first knowledge-based systems were rule based expert systems. Case-based reasoning (사례기반추론) https://en.wikipedia.org/wiki/Case-based_reasoning https://engineering.purdue.edu/~engelb/abe565/knowacq.htm 여기서 아이디어를 조금 얻을 수 있을 것 같은데…. Rule Development Although complex representation techniques might eventually be used, rules are generally easier to use for characterizing knowledge during knowledge acquisition. Prototypic rules should be developed as soon as possible to serve as a focal point for directing the course of the knowledge acquisition process. The initial knowledge base can be developed from written materials or from example cases described by the expert during early unstructured interviews. Initial ru...

다변량분석

이와 같은 통계적 방법으로서 대표적인 것으로서는, 변수들 사이의 유사성을 찾아낼 수 있는 요인분석(factor analysis), 이미 설정되어 있는 피험자 집단의 적절성을 확인하는 판별분석(discriminant analysis), 독립변수의 수준에 따라 피험자를 집단으로 구분하는 군집분석(cluster analysis), 여러 개의 종속변수에 대한 분석을 위한 다변량분산분석(MANOVA), 요인분석과 회귀분석의 혼합형인 구조방정식모형(structural equation model), 여러 개의 변수집단들 사이의 상관계수를 추정하는 정준상관계수(canonical correlation) 등이 있다.

Scrap - interval regression // prediction interval vs confidence interval

이미지
구글 https://goo.gl/A9M3Qp 한글 stata http://blog.naver.com/neochina/70046806952 Ucla https://stats.idre.ucla.edu/r/dae/interval-regression/ https://www.youtube.com/watch?v=vj7udRCIyOo Prediction interval → 이거 같은데,   http://www.r-tutor.com/elementary-statistics/simple-linear-regression/prediction-interval-linear-regression 구글 "Prediction Interval for Linear Regression" https://goo.gl/9KqJNm https://en.wikipedia.org/wiki/Interval_estimation https://en.wikipedia.org/wiki/Prediction_interval Interval regression 에서, 일단 들어가는 값이, 어떠한 정확한 한 점의 값이 아니라, interval 이야. 50~60 이렇게.  (income level 등을 조사하면 데이터가 이렇게 될 수 밖에 없겠지. ) 그런데 이것은 어떤 ordered probit 처럼 몇가지 형태로 통일될 필요가 없어. 그리고 나서 이것을 prediction 할때에는, 정확한 하나의 값으로 도출 할 수도 있고 (YOUTUBE 참고), 그냥 기존의 결과처럼 어디에 속하는지 결정해서 보여줄 수도 있어(UCLA참고). http://www.r-tutor.com/elementary-statistics/simple-linear-regression/prediction-interval-linear-regression Prediction Interval for Linear Regression Ass...

Hazard-based duration models / censored

이미지
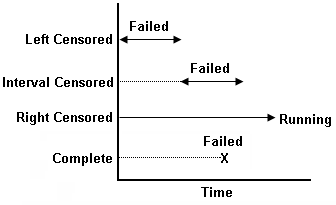
Hazard-based duration model을 이용한 고속도로 돌발상황 지속시간 추정에 관한 연구 http://academic.naver.com/view.nhn?doc_id=9357404&dir_id=0&page=0&query=Hazard-based%20duration%20models&ndsCategoryId=10526 신치현, 김정훈 (2002) 이신혜 (1996) → 처음 이용 / 지속시간모형을 이용한 판매시설 이용자의 주차시간 추정에 관한 연구 What is staus ? http://stat.ethz.ch/R-manual/R-devel/library/survival/html/Surv.html The status indicator, normally 0=alive, 1=dead. Other choices are TRUE/FALSE (TRUE = death) or 1/2 (2=death). For interval censored data, the status indicator is 0=right censored, 1=event at time, 2=left censored, 3=interval censored. Although unusual, the event indicator can be omitted, in which case all subjects are assumed to have an event. https://en.wikipedia.org/wiki/Censoring_(statistics) Distribution 선택을 위한 방법 / 유튜브 https://www.youtube.com/watch?v=rJd3apSGDGI https://github.com/ryandata/Survival/blob/master/Survival.R Survival analysis / confidence interval https://www.yout...

Confusion Matrix

http://www.dataschool.io/simple-guide-to-confusion-matrix-terminology/ true positives (TP): These are cases in which we predicted yes (they have the disease), and they do have the disease. true negatives (TN): We predicted no, and they don't have the disease. false positives (FP): We predicted yes, but they don't actually have the disease. (Also known as a "Type I error.") false negatives (FN): We predicted no, but they actually do have the disease. (Also known as a "Type II error.") Accuracy: Overall, how often is the classifier correct? (TP+TN)/total = (100+50)/165 = 0.91 Misclassification Rate: Overall, how often is it wrong? (FP+FN)/total = (10+5)/165 = 0.09 equivalent to 1 minus Accuracy also known as "Error Rate" True Positive Rate: When it's actually yes, how often does it predict yes? TP/actual yes = 100/105 = 0.95 also known as "Sensitivity" or "Recall" False Positive Rate: When it...

Bayesian Network

Bayesian Network http://cafe.naver.com/soynature/2388 Graph model ? 관찰되지 않는 events들에 대한 확실성의 추정을 해야 한다는 것이다. 기존의 그래프 개념에 의하면, 다른 방향으로의 분기화살표가 없는위의 그래프는, Buglary가 발생하면, 항상Alarm이 울리게 되어 있고, 이어서 반드시 MaryCalls가 발생하게 된다. 하지만 Bayesian Network에서는 Buglary가 발생하지 않았는데, Alarm이 발생할 수 있고, Alarm이 울리지 않았는데, MaryCalls가일어날 수 있다. 즉, 연결선이 확률적인 Conditional관계를 나타낸다는 것이 기존의 전이(Transient) 관계를 나타내는 Graph개념과 다르다. 인트로 http://blog.naver.com/rupy400/130114080851   (블로그, 번역이라 내용 안 좋음) Bayesian Network in r 구글에서 더 검색해보기 https://goo.gl/qq8zVc http://www.bnlearn.com/about/teaching/slides-bnshort.pdf Umd 도서관 https://goo.gl/qTG9zF

two standard deviations

이미지
https://en.wikipedia.org/wiki/Standard_deviation In science, many researchers report the standard deviation of experimental data, and only effects that fall much farther than two standard deviations away from what would have been expected are considered statistically significant —normal random error or variation in the measurements is in this way distinguished from likely genuine effects or associations. One SD -> 68% Two SD → 95% Three SD → 99.7% Dark blue is one standard deviation on either side of the mean. For the normal distribution, this accounts for 68.27 percent of the set; while two standard deviations from the mean (medium and dark blue) account for 95.45 percent; three standard deviations (light, medium, and dark blue) account for 99.73 percent; and four standard deviations account for 99.994 percent. The two points of the curve that are one standard deviation from the mean are also the inflection points.        ...

Scrap - Confidence intervals vs. standard deviation (2 sigma SD VS 95% confidence level)

이미지
https://stats.stackexchange.com/questions/151541/confidence-intervals-vs-standard-deviation The "2 sigma rule" where sigma refers to standard deviation is a way to construct tolerance intervals for normally distributed data, not confidence intervals (see this link to learn about the difference). Said shortly, tolerance intervals refer to the distribution inside the population, whereas confidence intervals refer to a degree of certainty regarding an estimation. In case you meant standard error instead of standard deviation (which is what I understood at first), then the "2 sigma rule" gives a 95% confidence interval if your data are normally distributed (for example, if the conditions of the Central Limit Theorem apply and your sample size is great enough). https://en.wikipedia.org/wiki/Standard_deviation Dark blue is one standard deviation on either side of the mean. For the normal distribution, this accounts for 68.27 percent of the ...

Student's t-distribution

위키 / https://goo.gl/bi24UW In probability and statistics , Student's t -distribution (or simply the t -distribution ) is any member of a family of continuous probability distributions that arises when estimating the mean of a normally distributed population in situations where the sample size is small and population standard deviation is unknown. It was developed by William Sealy Gosset under the pseudonym Student . The t -distribution plays a role in a number of widely used statistical analyses, including Student's t -test for assessing the statistical significance of the difference between two sample means , the construction of confidence intervals for the difference between two population means, and in linear regression analysis . The Student's t -distribution also arises in the Bayesian analysis of data from a normal family. If we take a sample of n observations from a normal distribution , then the t -distribution with {\displaystyle \nu =n-1} ...